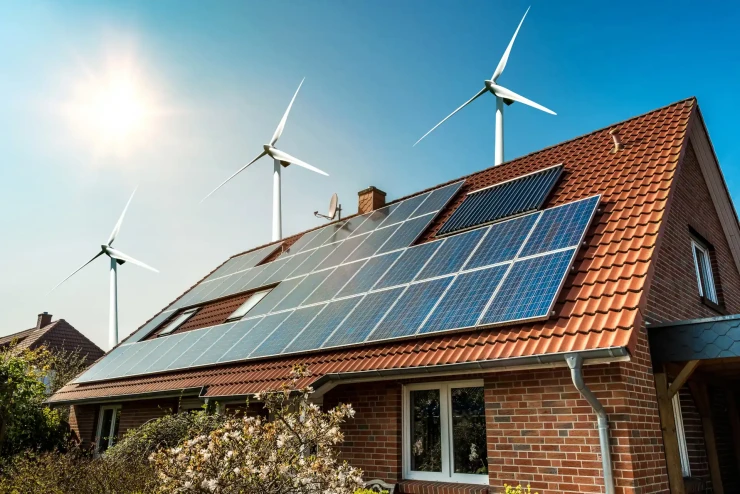
Solar energy in Brighton & Hove doesn’t underperform; it redistributes. Across the UK, nearly 69% of annual solar electricity is generated between April and September, leaving just 31% for the colder half of the year.
For homeowners, the real question isn’t whether solar works in winter, but how this uneven output affects annual savings, system sizing, and long-term ROI.
This guide breaks down exactly how solar performs across summer and winter in Brighton & Hove, using real output data and practical insights to help you plan for consistent, year-round performance.
COMPARE PRICES FROM LOCAL INSTALLERS
Compare prices from local companies fast & free
Enter your postcode to compare quotes from leading professionals. We promise to keep your information Safe & Secure. Privacy Policy
Summer vs Winter Solar Output: What Actually Changes?
Solar output shifts predictably across seasons, with daylight duration and irradiance acting as the primary limiting factors.
How Much Higher Is the Summer Generation Compared to Winter
Solar panels in Brighton & Hove typically generate 3–4 times more energy in summer than in winter due to extended daylight hours and stronger irradiance levels.
Between May and July, systems operate near peak capacity for longer durations, while output drops significantly in December and January.
Despite this decline, winter generation remains consistent enough to contribute to overall annual production without creating system inefficiencies.
Typical Daily Energy Difference (kWh Range)
A standard 4kW residential system produces around 14–18 kWh per day during peak summer months, compared to 2–5 kWh per day in winter, based on modelling from the REH solar generation calculator.
This predictable difference influences energy usage strategies, where summer supports export and storage, while winter offsets partial daytime consumption.
Daily output ranges are indicative and depend on system design, orientation, and weather conditions.
This seasonal gap sets the foundation, but monthly data reveals how output actually distributes across the year in measurable, actionable terms.
Monthly Solar Output Breakdown (kWh Reality Check)

|
|
|
|
|
|
|
|
|
|
|
|
|
|
|
|
|
|
|
|
|
|
|
|
|
|
|
|
|
|
|
|
|
|
|
Peak summer months alone can contribute 25–30% of annual generation, highlighting strong seasonal concentration.
With monthly trends established, the next step is isolating summer performance, where systems generate the majority of annual energy and financial value.
Solar Panel Performance in Summer (April–September)

Summer months drive the majority of solar energy generation in Brighton & Hove, offering extended production windows and higher irradiance levels that significantly increase total system output.
Average Daily Energy Production During Peak Months
Peak summer output consistently reaches 14–18 kWh/day.
- Extended daylight increases generation hours
- Stable output during clear conditions
- Surplus energy is often generated
This allows homeowners to export excess electricity or store it for later use.
Monthly Generation Pattern Across Summer
Generation rises from April, peaks in June–July, and gradually declines toward September.
- Monthly output: 500–600 kWh (peak)
- Consistent surplus above household demand
- Predictable production curve
This pattern enables better planning for energy usage, storage, and export optimisation. This is the period when systems generate their highest energy output and export potential.
Role of Extended Production Windows
Summer performance is driven more by duration than intensity.
- Panels operate from early morning to late evening
- Even moderate sunlight contributes to output
- Longer days increase cumulative generation
While summer drives peak output, understanding winter behaviour is essential to evaluate system consistency and real-world year-round performance.
Solar Panel Performance in Winter (October–March)

Winter reduces output but does not stop generation. Systems continue producing electricity consistently during available daylight hours.
Average Daily Energy Production in Winter
Typical winter output ranges between 3–6 kWh/day.
- Supports partial daytime energy usage
- Reduces grid dependency
- Works even under cloud cover
Cooler temperatures can slightly improve panel efficiency, offsetting some irradiance losses.
Monthly Generation Trends
Winter production reaches its lowest in December and January.
- Monthly output: 120–200 kWh
- Gradual recovery begins in February
- Predictable seasonal increase
How Reliable Is Winter Solar Output?
Despite reduced sunlight, solar remains reliable in winter.
- Works with diffuse daylight
- Generates during overcast conditions
- Maintains steady baseline output
While total energy is lower, performance remains stable and contributes to annual savings.
To understand why this drop occurs, it’s important to look at the environmental factors affecting winter solar performance.
Why Solar Energy Production Declines in Winter
Winter performance is shaped by environmental constraints that reduce both available sunlight and system efficiency, leading to lower overall energy generation compared to summer months.
Shorter Daylight Duration
Daylight hours in winter drop to approximately 7–8 hours per day, compared to over 16 hours in summer. This directly limits the amount of time solar panels can generate electricity, regardless of efficiency.
As a result, total daily output decreases significantly, making daylight duration the most influential factor affecting seasonal solar performance.
Lower Solar Angle and Reduced Irradiance
During winter, the sun remains lower in the sky, reducing the intensity of direct sunlight hitting solar panels. This lower angle increases reflection losses and reduces effective irradiance, especially during early morning and late afternoon hours.
These factors collectively contribute to a noticeable drop in overall system efficiency during the winter months.
Increased Cloud Cover and Weather Variability
Winter conditions in Brighton & Hove include higher cloud density and more frequent overcast days, which reduce direct sunlight exposure. Although solar panels can generate electricity using diffuse light, output levels remain lower compared to clear-sky conditions.
This variability leads to less consistent daily generation patterns and contributes to overall seasonal output decline.
These constraints explain the drop, but annual performance shows how these losses balance out over the full year.
Average Annual Solar Generation in Brighton & Hove
Solar generation in Brighton & Hove offers a stable and predictable performance baseline, making it easier to estimate savings and long-term ROI.
Typical kWh per kWp Output
Solar systems in Brighton & Hove typically generate between 950–1,050 kWh per kWp annually. This range reflects real-world performance after accounting for seasonal variation, weather conditions, and system losses.
At this performance level, most systems achieve payback within 6–10 years, depending on energy usage patterns and export rates.
Expected Output by System Size
|
|
|
|
|
|
|
|
|
|
|
|
Output variations depend on factors such as roof orientation, shading, and installation quality, but overall performance remains consistent across different system sizes.
Regional Performance Advantage
Brighton & Hove benefits from slightly higher solar irradiance compared to northern UK regions, resulting in improved annual generation levels. This geographic advantage enhances overall system efficiency and increases potential savings.
While seasonal variation still exists, the higher baseline output supports stronger long-term financial returns for homeowners investing in solar energy systems.
For homeowners looking to translate these averages into real savings, platforms like Renewable Energy Hub provide tailored system assessments based on roof conditions, usage patterns, and local irradiance data.
Annual benchmarks provide clarity, but applying them to a real system example makes seasonal variation easier to quantify and evaluate.
4kW Solar System Output: Real Monthly and Annual Performance
A 4kW solar system provides a practical reference point for understanding how seasonal variation translates into real-world energy production across different months.
Summer Output Levels
During peak summer months, a 4kW system can generate between 500–600 kWh per month according to the Energy Saving Trust, with daily output reaching up to 18 kWh under optimal conditions.
- Production often exceeds household demand
- Creates surplus energy for export to the grid
- Can also be stored for later use
- Improves overall system efficiency
Winter Output Levels
In winter, monthly generation drops to approximately 120–200 kWh, with daily output ranging between 3–6 kWh according to UK government renewable energy data.
- Still supports daytime electricity usage
- Reduces reliance on grid electricity
- Provides consistent baseline generation
Even in low-light conditions, the system continues producing usable energy.
Annual Output Distribution
A 4kW system in Brighton & Hove follows a clear seasonal pattern where most energy is generated in summer.
|
|
|
|
|
|
|
|
|
|
|
|
|
|
|
|
|
|
|
|
- The majority of energy is produced during summer months
- Winter ensures continuous year-round generation
- Overall system performance remains stable annually
Output alone isn’t enough; correct system sizing ultimately determines real-world performance and ROI.
How Seasonal Output Affects System Sizing in Brighton & Hove
System sizing must account for annual energy consumption rather than peak seasonal output to ensure optimal efficiency, minimise energy waste, and maximise financial returns over time.
Should You Size for Summer or Year-Round Usage?
Solar systems should be sized based on total annual consumption rather than peak summer generation levels. Oversizing a system to match summer output often results in excess energy being exported at lower tariff rates.
In contrast, balanced sizing improves self-consumption rates, ensuring more generated energy is used directly within the household.
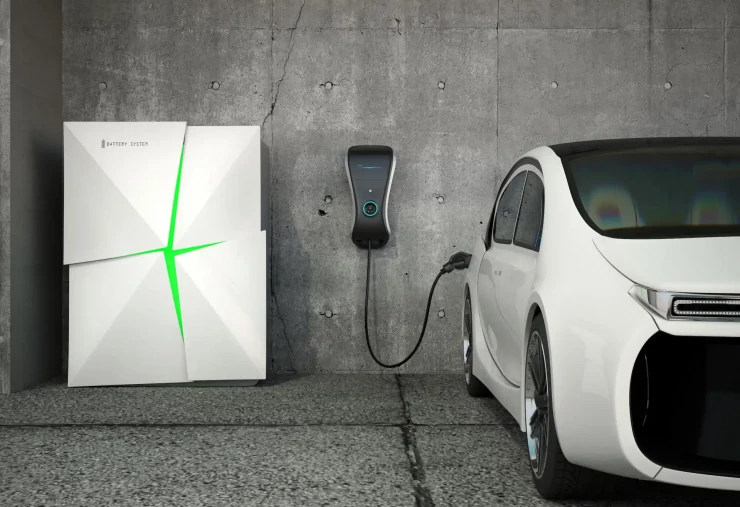
Impact on Battery Storage Decisions
Battery storage capacity should be aligned with surplus summer generation rather than winter demand levels. Oversized batteries may remain underutilised during winter months when excess energy is limited.
Proper battery sizing ensures efficient energy storage, maximises usage of generated power, and improves overall return on investment.
Balancing Export and Self-Consumption
Optimising the balance between exported energy and self-consumption is critical for maximising financial returns.
Higher self-consumption reduces reliance on grid electricity, while export tariffs provide additional income from surplus energy.
A well-designed system ensures that both factors are balanced effectively across seasonal variations.
Working with verified providers through Renewable Energy Hub helps ensure your system is correctly sized for annual consumption rather than seasonal peaks, avoiding overproduction losses and improving long-term ROI.
Is Solar a Smart Investment in Brighton & Hove?
Solar delivers strong long-term financial value when assessed on total annual performance rather than seasonal variation.
In Brighton & Hove, higher solar irradiance compared to northern UK regions supports consistent yearly output, making solar a reliable investment when properly sized and installed.
Year-Round Savings Potential
Solar systems typically offset 40–60% of annual electricity usage, depending on system size and household consumption patterns.
Key benefits:
- Reduces reliance on grid electricity
- Protects against rising energy costs
Over time, solar systems deliver predictable long-term financial performance rather than short-term seasonal gains.
Role of Summer Surplus
Summer production plays a critical role in balancing annual performance.
- Extended daylight increases generation significantly
- Excess energy is exported or stored in batteries
- Helps compensate for lower winter output
This surplus ensures that total yearly generation remains financially efficient and balanced.
Impact of Export Tariffs
Export schemes such as the Smart Export Guarantee allow homeowners to earn from unused electricity.
- Export payments add additional income
- Higher self-consumption increases direct savings
- Combined effect reduces payback period
This improves the overall return on investment over a typical 20–25 year system lifespan.
Once viability is established, optimisation becomes the priority—refining system design and usage to maximise output across seasonal variation.
How to Improve Solar Performance Across Seasons
System design and usage strategy directly determine year-round solar performance, helping reduce the impact of seasonal variation on total energy output.
- Panel orientation and tilt: South-facing systems with a 30–40° tilt achieve optimal year-round performance by maximising sunlight exposure across both summer and winter months.
- Installation quality: Proper wiring, accurate inverter sizing, and correct panel placement minimise energy losses and ensure consistent system efficiency.
- Shading management: Avoid obstructions like trees, chimneys, or nearby buildings, as even partial shading can significantly reduce output.
- Microinverter optimisation: Microinverters improve performance in partially shaded conditions by allowing panels to operate independently.
- Battery storage usage: Store excess summer energy for use during evenings or low-generation periods to improve energy utilisation.
- Self-consumption strategy: Use more electricity during daylight hours to maximise direct solar usage and reduce reliance on the grid.
Properly integrated storage solutions help stabilise energy costs and enhance overall system efficiency throughout seasonal fluctuations.
|
|
Conclusion
Solar in Brighton & Hove isn’t a question of viability, it’s a question of optimisation. Seasonal variation is built into system performance, but when designed correctly, it becomes an advantage, not a limitation.
High summer generation drives surplus, export income, and faster payback, while consistent winter output reduces baseline grid dependency. The result is a balanced, year-round energy system that supports long-term savings.
The difference between average and high-performing systems comes down to design, installation quality, and usage strategy.
Compare verified installers through Renewable Energy Hub to ensure your system is engineered for maximum annual return, not just peak output.
Request a Personalised Solar Output & Savings Estimate in Brighton & Hove
Solar performance varies across every property, and seasonal output differences directly impact savings, system sizing, and long-term returns, especially in Brighton & Hove.
At Renewable Energy Hub, we help you understand what your roof can realistically generate across summer and winter by connecting you with Microgeneration Certification Scheme-certified installers.
We assess your roof conditions, estimate annual output, and recommend systems designed for balanced year-round performance.
By filling out a quick form, you can compare up to three tailored quotes and evaluate expected savings before making a decision.
Request Your Free Solar Quote
Find a local installer
Welcome to the biggest directory of UK renewable energy companies